These results come from synthetic option chains built from SPX and VIX history, not from recorded quotes. The pricing model was fitted to a real sample where one was available and its error is reported below. Fills, slippage and fees are modeled. Treat every number as an estimate of the strategy's shape, not a forecast of returns. Report date 2026-10-20.
Method
Each session replays the live pipeline. The morning decision runs on the opening snapshot with the policy and the hard rules, with at most one entry. A closing snapshot then handles mandatory exits and marks.
Entries use 30 to 45 days to expiration and 50 point wings. Size is 10 contracts per spread with at most 7 open positions and the live risk caps. Period 2012-01-03 to 2026-10-16, seed 7.
Baseline
Baseline is a deterministic rule set with no model in the loop. Shorts sit at 0.16 or 0.12 delta by premium richness, with the far side on the trend's side. Exits are the profit target, the 21 day time exit, a touched strike, or the hard stop.
| Metric | Baseline |
|---|---|
| Sessions | 3,718 |
| Trades | 1,244 |
| Total P/L | +$2,107,005 |
| P/L per month | +$11,901 |
| Share of the $10,000 monthly target | 119% |
| Monthly mean / std | +$11,904 / 30,016 |
| Worst month | -$106,095 |
| Losing months | 24% |
| Losing quarter probability | 21% |
| Max drawdown | $181,715 (-14.7%), 249 sessions |
| CAGR | 11.8% |
| Calmar | 0.33 |
| Sharpe | 1.30 |
| Win rate | 76% |
| Average winner / loser | +$4,341 / -$6,620 |
| Profit factor | 2.06 |
| Worst trade | -$18,690 |
| Trades per month | 7.0 |
| Average days held | 13.7 |
| Time in market | 70% |
| Fees paid | $149,280 |
| Close reason | Trades | P/L |
|---|---|---|
| DELTA_BREACH_CALL | 59 | -$252,280 |
| DELTA_BREACH_PUT | 127 | -$823,640 |
| GAMMA_RISK | 222 | +$341,960 |
| HARD_STOP | 54 | -$640,660 |
| PROFIT_TARGET | 773 | +$3,616,520 |
| STRIKE_TOUCHED_PUT | 9 | -$140,710 |
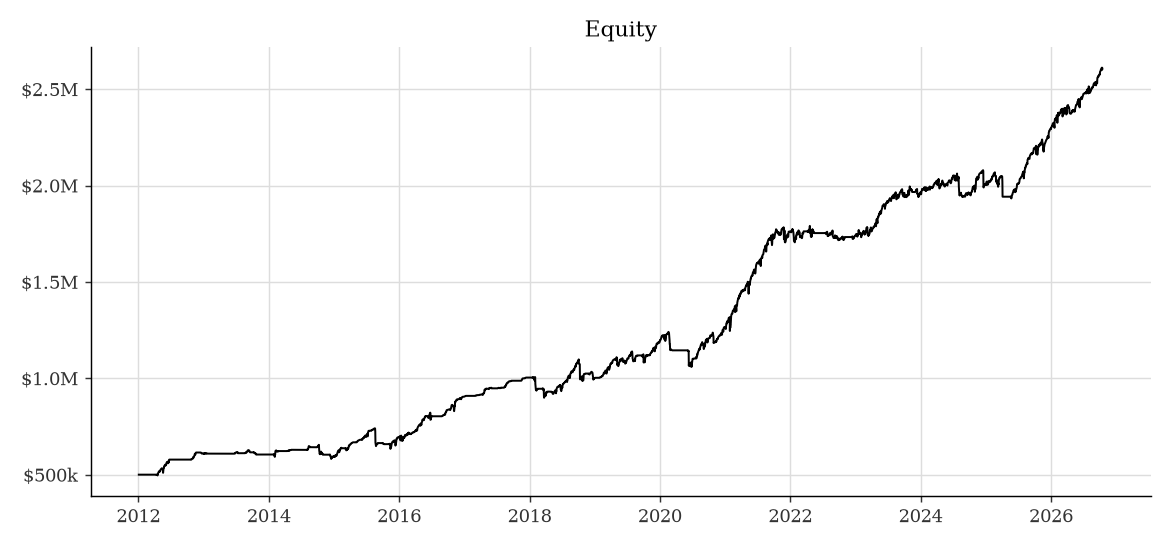
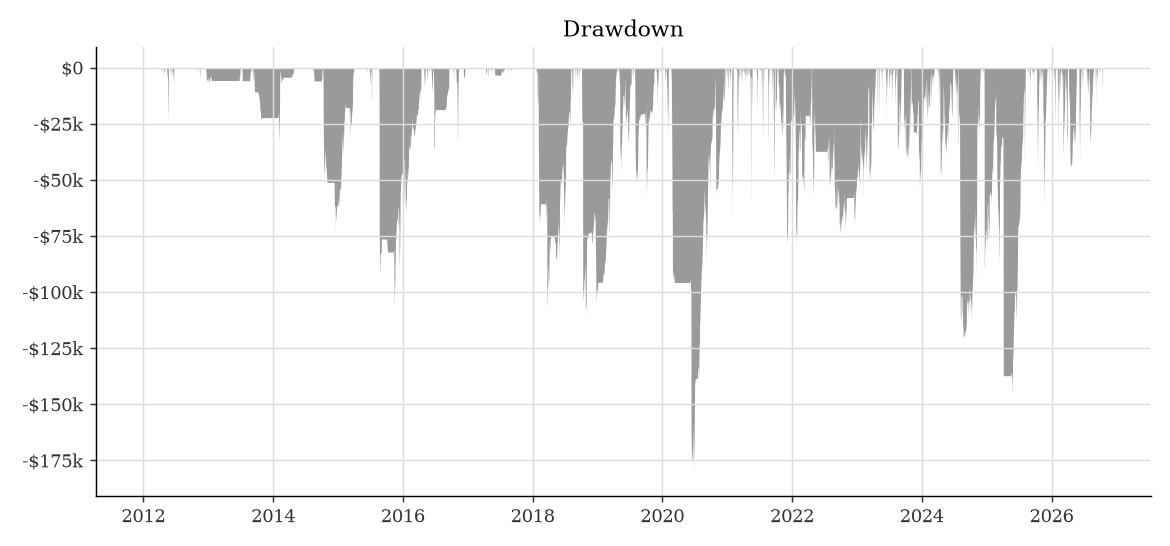
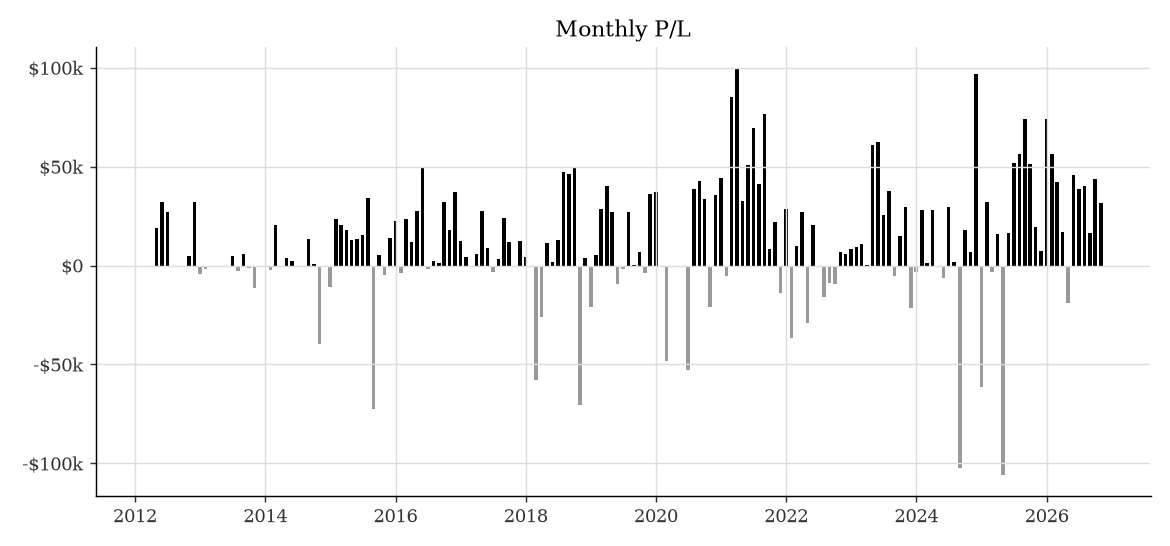
Risk at full size
At 10 contracts the worst modeled drawdown was $181,715 over 249 sessions. The worst month was -$106,095. The bootstrap 95 percent interval for the monthly mean was +$7,556 to +$16,240. The probability of a losing quarter was 21 percent.